
A dashboard has two hidden costs: creating it and maintaining it. Most tools solve the first (an assistant generates the SQL queries), then abandon the second (data goes stale, no one refreshes it). KittyClaw takes a different approach, and it fits in three sentences:
The LLM writes the tile once, via chat. The refresh runs periodically with zero LLM tokens, via a shell or PowerShell script. And the generated output.md serves both the human and the agents watching the project.
This triple economy (minimal upfront cost, zero-cost operation, closed loop) is what I want to describe here.
This piece documents KittyClaw, the kanban orchestrator at the center of the Ekioo agent-fleet R&D. Alongside Bloomii (constructive-journalism media) and Kalceo (regulatory B2B SaaS for construction contractors), KittyClaw runs the AI agents that drive these projects in production.
The .dashboard/<slug>/ primitive
Each tile is a folder in the repository:
.dashboard/
  monthly-revenue/
    tile.yaml        ← template, refresh, prompt, title
    script.ps1       ← collects data (optional)
    output.json      ← data rendered by the dashboard
  health/
    tile.yaml
    script.ps1       ← collects project metrics
    data.json        ← produced by script.ps1
    output.md        ← generated by LLM from data.json
The tile.yaml declares three things:
template: kpi          # one of: kpi, kpi-grid, donut, bar-chart,
                       #         sparkline, progress, heatmap,
                       #         status-grid, gauge, leaderboard,
                       #         table, timeline, markdown, mermaid, image
title: Monthly revenue
refresh: 86400         # in seconds. 0 = never auto-refresh
When a refresh fires:
- KittyClaw runs
script.*if present → producesdata.json - If the tile has a
prompt, KittyClaw calls the LLM withdata.jsonas context → writesoutput.jsonoroutput.md - If the tile has no prompt,
output.*is read directly as-is
The second step is the only one that consumes tokens, and only on markdown tiles that synthesize raw data. kpi, bar-chart, sparkline, and similar tiles render output.json server-side: zero LLM at runtime.
Tile gallery: the BrewCo project
To illustrate the range of templates without screenshotting a real production project (real numbers stay private), I created BrewCo: a fictional chain of 12 coffee shops. Eleven tiles, seven different templates, all fed by realistic JSON.
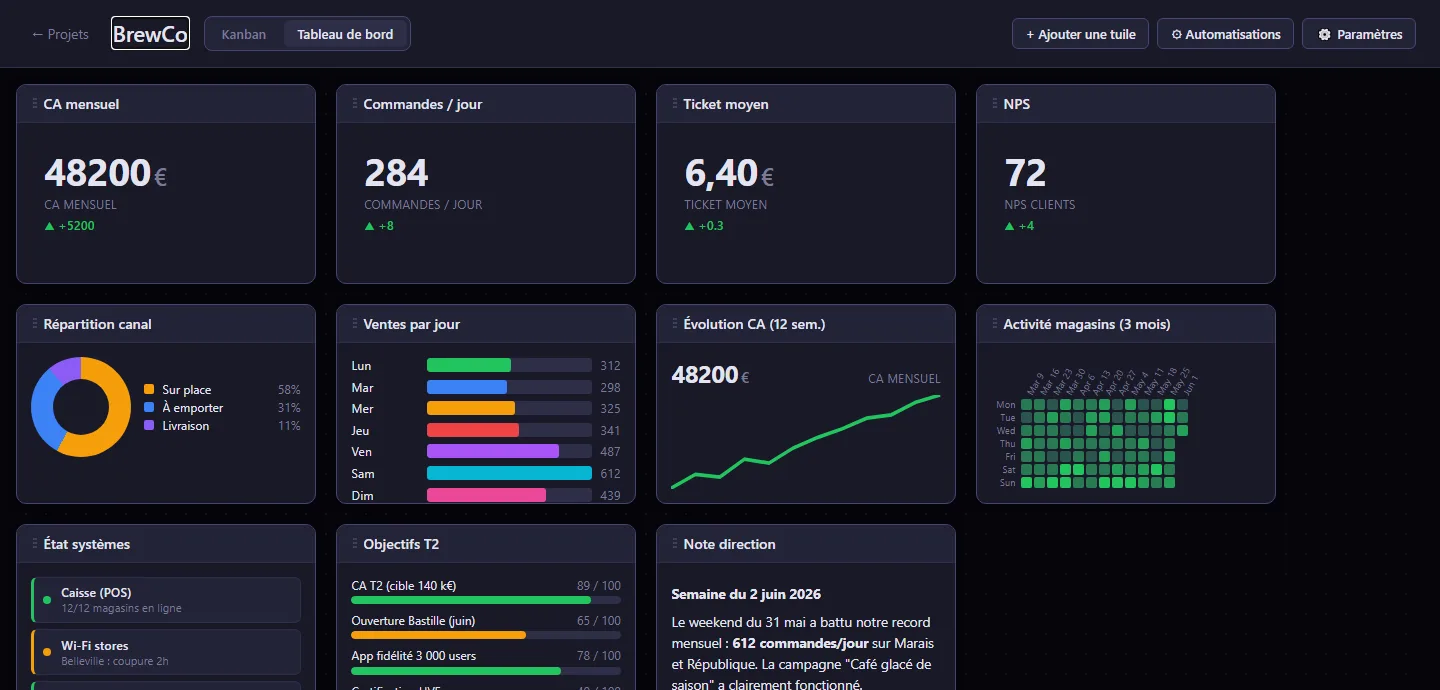
First row: quick scan. Four kpi tiles: monthly revenue, orders/day, average ticket, NPS. Each is an output.json with five fields (value, label, unit, delta, trend). Delta and trend arrow are rendered automatically.
Second row: analytical reading. A donut (channel breakdown: 58% dine-in, 31% takeaway, 11% delivery), a bar-chart (sales by day of the week, Saturday at 612 stands out immediately), a sparkline (revenue trend over 12 weeks), and a GitHub Calendar-style heatmap showing the last 90 days of activity.
Third row: state and context. A status-grid (6 systems with ok/warn/err status, one store's Wi-Fi is in warn), progress bars for Q2 objectives, and a markdown tile for the weekly management note.
Each template has its own JSON schema, documented in the interface: the tile creation AI chat automatically injects the correct schema into its prompt.
The closed loop: Lain reads output.md
What makes this primitive particularly powerful is that the output.md files from analytical tiles naturally become inputs for other agents.
On the ekioo project, the health tile produces a daily output.md that cross-references ticket metrics (velocity, blocks, stale tickets), Umami traffic data, and Search Console SEO signals. This file is read by Lain, the CEO agent that reviews the board every hour:
# .dashboard/health/tile.yaml
template: markdown
refresh: 86400
prompt: 'Read the JSON at .dashboard/health/data.json, which contains
  ticket metrics, roadmap goals, and optionally umami (traffic) and
  gsc (SEO) data. Cross-reference all signals. Format: Diagnostic
  (3 sentences), Risks (2 bullets), Action of the week (1 bullet).
  Be opinionated. Output ONLY the raw markdown.'
Lain doesn't poll the KittyClaw API 30 times to reconstruct a global state. It reads health/output.md, a document already synthesized, up to date, in natural language, and decides from there whether a ticket needs escalating or an SEO opportunity deserves immediate action. A single LLM call consumes an already-processed context.
It's the same logic as caching in a backend architecture: compute once, serve N times.
The dashboard isn't just for tech projects
BrewCo isn't a dev project. It's a coffee chain. And the tiles work exactly the same way: a PowerShell script reads a CSV export from the POS system, produces data.json, and the dashboard shows the weekend's KPIs.
The primitive (tile.yaml + script.* + output.*) is generic enough to monitor business metrics, marketing campaigns, or physical operations. The only constraint is that the data be readable by a script. If it is, the dashboard can display it.
This is deliberate. KittyClaw is a project management and agent orchestration tool, not a BI SaaS. The dashboard is an observability layer, not an end in itself.
Observability between human and agents
What interests me about this architecture is that it solves a coordination problem that agentic systems create: humans and agents need to see the same reality, but at different granularities.
The human wants a high-level view: a few numbers, a trend, an alert. The agent wants a structured input it can reason over. The health tile's output.md is both at once: readable by a human in 30 seconds, parseable by an agent in a single call.
This isn't an infrastructure revolution. It's a text file regenerated every night. But it's exactly the right abstraction for the layer between the human who steers and the agents who execute.